Spectroscopy is the principle of measuring an object’s properties using electromagnetic radiation. In simple terms it is the same principle that lets you determine how ripe a berry is by looking at its color and applying your previous knowledge about berries.
Near infrared (NIR) spectroscopy in particular has been gaining traction in recent years as the components necessary to measure these spectra have become cheaper, better and more widely available.
I recently got my hands on a demo kit of the Austrian chip manufacturer AMS that shows off their AS7265 NIR spectrometer chips. It consists of a credit card sized PCB with three spectrometer ICs each of which has six light sensitive pixels. All these pixels together span a wavelength range from 410 nm to 940 nm covering the visible spectrum and the a small section of the NIR range.

Since the kit lacks Linux software to interact with the device I made a small Qt tool to get a first impression of its features. The application lets you measure spectra and control some settings on the device such as the sensor’s gain and integration time.
This article contains a write-up of the application introducing some details of the architecture, as well as a first impression of the measurements conducted with the demo kit.
Application Write-Up
I would like to introduce a few techniques I used in the development of this tool, that regularly come in handy in Qt projects. These are:
- Structuring the application logic through states using a QStateMachine in C++ and accessing these states in QML.
- Displaying and updating live data in a QML ChartView
- Listing and connecting to a remote device using QSerialPortInfo and QSerialPort
The full code of this application can be found through the link at the end of this article.
Getting a Cleaner Structure Using States
Using a finite state machine is a great way to bring structure to an applications logic. It forces you to break down the inner behavior of an application prior to diving into the implementation. This way it can save us from writing long nested if clauses that clutter up functions and make the code harder to maintain and more error prone.
In this case the applications state machine is simple enough and represents the states of the connection and the device:
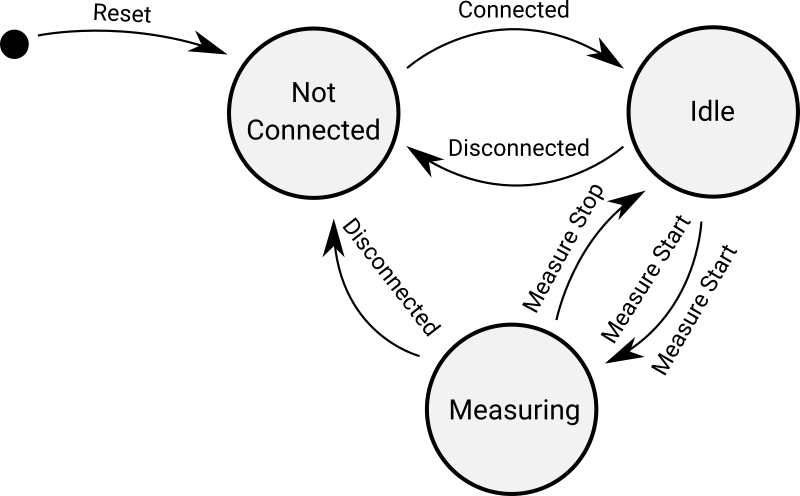
These can be broken down into three states:
- Not connected – the default state once the application starts
- Idle – once the application is connected to the spectrometer
- Measuring – the application is ready to continuously receive data from the spectrometer
The implementation of the state machine then looks like this:
stateNotConnected = new QState(&stateMachine);
stateNotConnected->assignProperty(this, "state", "notConnected");
connect(stateNotConnected, &QState::entered, this, &SensorHandler::onStateNotConnectedEntered);

stateIdle = new QState(&stateMachine);
stateIdle->assignProperty(this, "state", "idle");
connect(stateIdle, &QState::entered, this, &SensorHandler::onStateIdleEntered);

stateMeasuring = new QState(&stateMachine);
stateMeasuring->assignProperty(this, "state", "measuring");
connect(stateMeasuring, &QState::entered, this, &SensorHandler::onStateMeasuringEntered);

stateNotConnected->addTransition(this, &SensorHandler::connected, stateIdle);
stateIdle->addTransition(this, &SensorHandler::measuringStarted, stateMeasuring);
stateIdle->addTransition(this, &SensorHandler::disconnected, stateIdle);
stateMeasuring->addTransition(this, &SensorHandler::measuringStopped, stateIdle);
stateMeasuring->addTransition(this, &SensorHandler::disconnected, stateIdle);

stateMachine.setInitialState(stateNotConnected);
stateMachine.start();
Each of the three states is added to the state machine and given the transitions shown in the state chart above. Each state also gets hooked up to a onStateEntered function that in this case is used for debugging only.
In order to communicate the state changes to QML the containing C++ class is given a state property, that will contain the current state in a string representation.
Q_PROPERTY(QString state READ getState WRITE setState NOTIFY stateChanged)This property can be updated automatically when entering a new state by assigning the property to the state like this:
stateNotConnected->assignProperty(this, "state", "notConnected");
stateIdle->assignProperty(this, "state", "idle");
stateMeasuring->assignProperty(this, "state", "measuring");
The state property can then be used to set and update the state of a QML Item that mirrors the state names and takes care of the necessary property changes for the UI components. This way the UI states are guaranteed to follow the backend state and can be easily managed in one place.
Item {
    id: statesItem
    state: sensorHandler.state
    states: [
        State {
            name: "notConnected"
            PropertyChanges { target: connectionDialog; visible: true }
            PropertyChanges { target: toolBar; enabled: false }
        },
        State {
            name: "idle"
            PropertyChanges { target: connectionDialog; visible: false }
            PropertyChanges { target: toolBar; enabled: true }
            PropertyChanges { target: buttonMeasure; icon.source: "qrc:/icons/play_arrow-24px.svg" }
        },
        State {
            name: "measuring"
            PropertyChanges { target: connectionDialog; visible: false }
            PropertyChanges { target: toolBar; enabled: true }
            PropertyChanges { target: buttonMeasure; icon.source: "qrc:/icons/stop-24px.svg" }
        }
    ]
}
Displaying and Updating Live Data
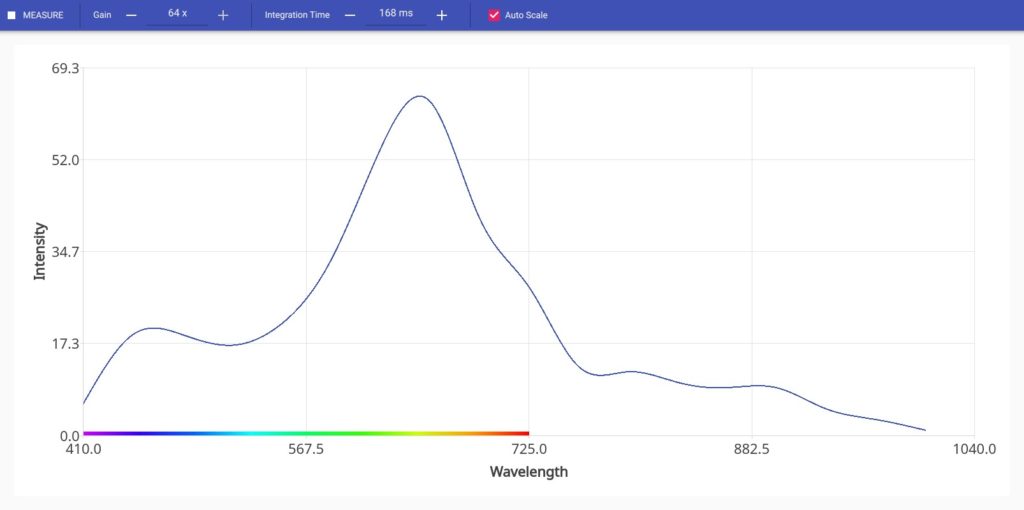
The display and updating of the data received from the spectrometer mostly follows Qt’s oscilloscope example. Since the spectral measurements have a large intensity range that needs to be displayed I added an auto scale option to the chart.
With every update to the displayed data the maximum intensity value of the spectrum is determined.
for(int i = 0; i < spectralData.size(); i++)
{
    points.append(QPointF(xOffset + xStep * i, spectralData.at(i)));
    if(spectralData.at(i) > yMax)
        yMax = spectralData.at(i);
}
This value is exposed to the ChartView through a property in the class which holds the measured data.
//C++
Q_PROPERTY(qreal yMax READ getYMax NOTIFY yMaxChanged)

//QML
ValueAxis {
    id: axisY
    readonly property int maxYValue: 2**16
    min: 0
    max: autoScale ? spectraProvider.yMax * 1.1 : maxYValue
    titleText: "Intensity"
}
Listing Serial Ports and Connecting to Serial Devices
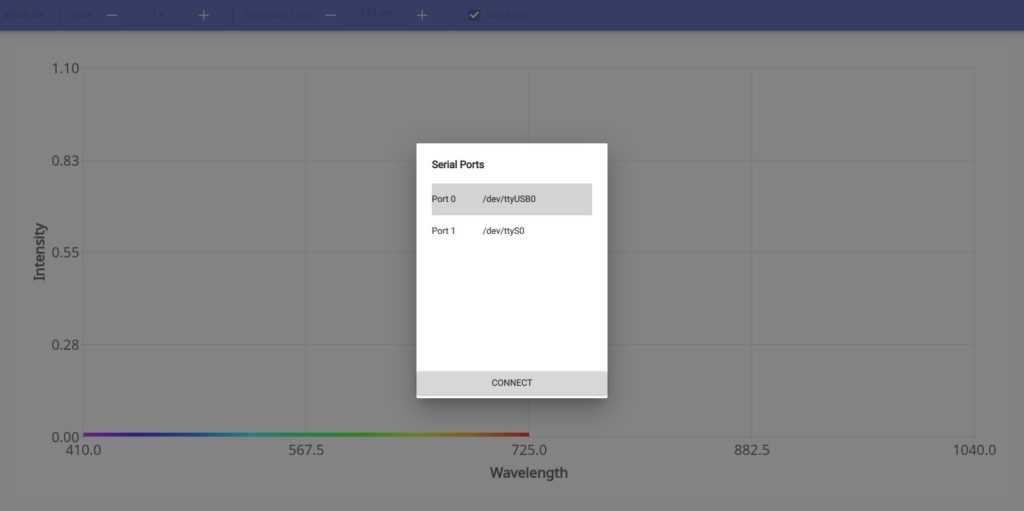
As do many other devices the AMS demo kit comes with an emulated serial port using an FTDI chip and USB. This means with any up to date Linux distribution there should be no driver issues. Once you connect the board it shows up as a TTY device with a location such as /dev/ttyUSBx where x is the assigned port number.
I used a lazy approach to list and display the serial devices using their system location only and exposing a list of these devices to QML as a list of strings. The list here is marked constant, since the ports are scanned for only once when starting the application.
Q_PROPERTY(QStringList serialPorts READ getSerialPorts CONSTANT)Listing the serial ports is a one-liner using a static function of QSerialPortInfo. After acquiring the list of ports the according locations are added to the list of ports.
QList<QSerialPortInfo> ports = QSerialPortInfo::availablePorts();
for(auto port: ports)
{
    portLocations.append(port.systemLocation());
}
This string list property is used as the model of a ListView inside the connection dialog. The individual strings can be accessed using modelData, since no roles are defined in this simple model.
ListView {
    id: portList
    anchors.margins: 16
    model: application.serialPorts
    //[...]
    delegate: Item {
        height: 50
        anchors { left: parent.left; right: parent.right }
        Label {
            anchors.verticalCenter: parent.verticalCenter
            text: "Port " + model.index + "\t" + modelData
        }
        MouseArea {
            anchors.fill: parent
            //[...]
            onDoubleClicked: {
                sensorHandler.openSerialPort(modelData)
            }
        }
    }
}
Example Measurements
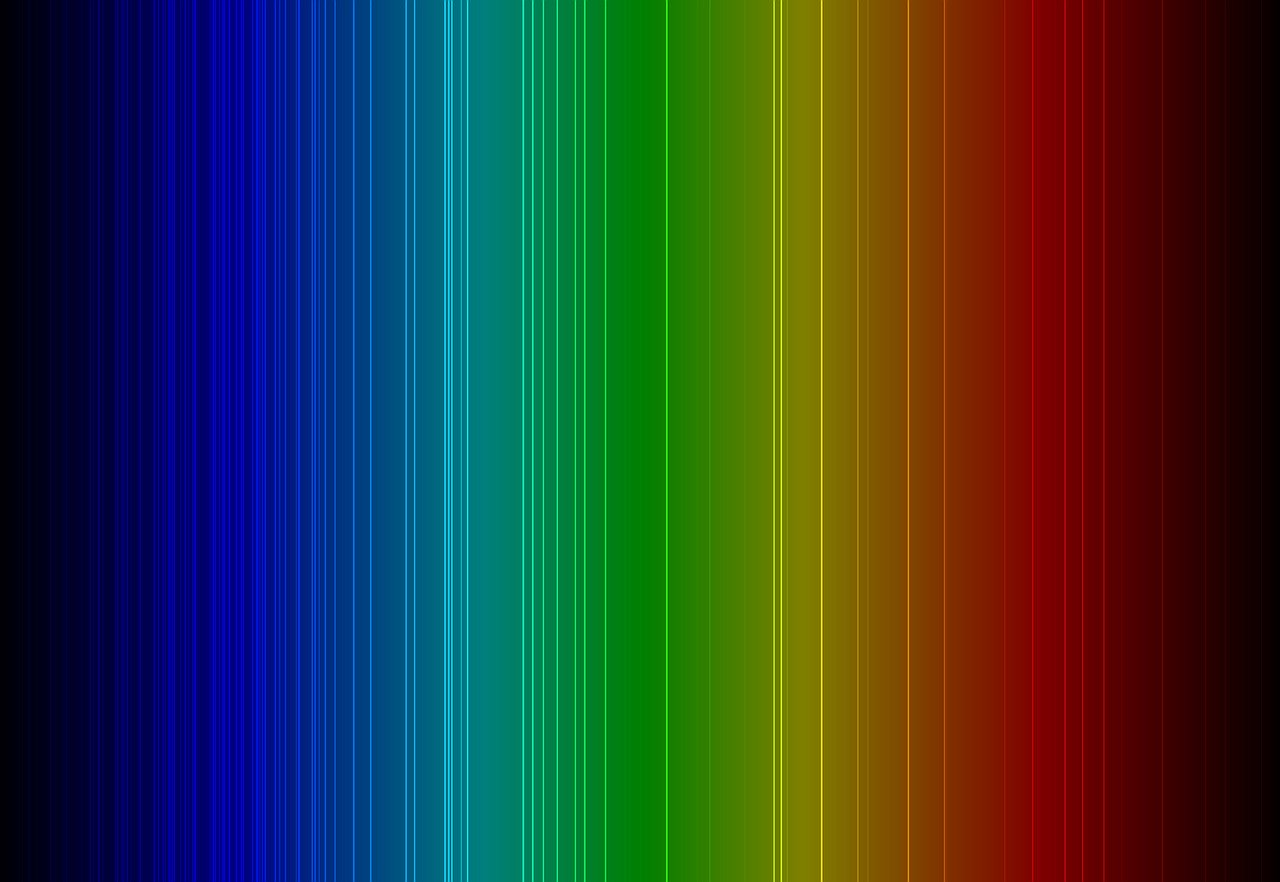
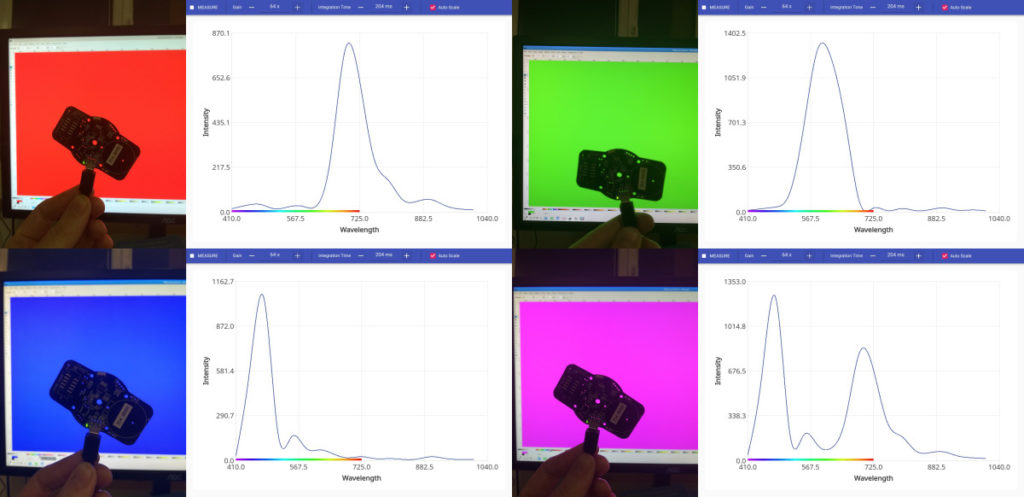
With this tool I tested the spectrometer on the closest source of light I could find. I used Inkscape to quickly display a few colored rectangles on the PC monitor and recorded the spectra. Little surprisingly in the screenshots you can make out the distinct wavelengths of the RGB pixels on the screen.
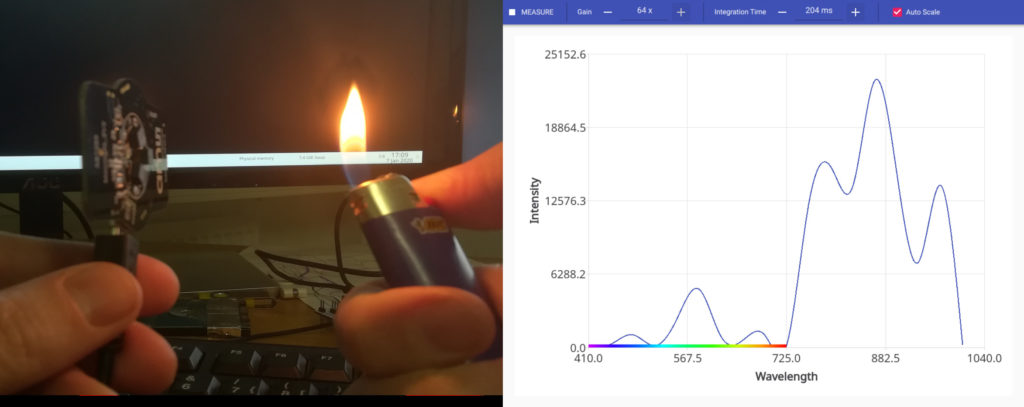
Since there were no NIR components in these spectra I used a lighter to record a warmer spectrum. Note that in this setting no diffusor is being used for the light hitting the sensors. Therefore it is possible that some pixels are in the shadow created by the IC’s housing and don’t receive any light purely through the geometry of the measurement.
The sources of the tool can be found on GitHub. Since this is a minor experimentation project there surely are some dead ends and fixmes in the code. If you have comments, questions, ideas for improvement let me know.
https://github.com/wbt729/ams_spectro_demo